How to Forecast Prop Firm Profitability in 2026
Challenge fee revenue is straightforward – predictable, repeatable, and well understood. The real complexity emerges when projecting what a prop trading firm will actually retain. This is where most financial models break down.
The reason comes down to one factor: funded-phase exposure. This cost materializes when traders succeed and payouts come due, and it represents the largest variable in most prop firm P&Ls. Under traditional models, this line item doesn’t resolve to a fixed number but to a range, making accurate forecasting impossible.
This article examines the mechanics of prop firm profitability forecasting through two structurally distinct approaches to funded-phase cost management: the internalization model and the full risk transfer model.
Why Prop Firm P&Ls Fail
Revenue forecasting in the prop business follows clear patterns. You know your challenge pricing, your monthly purchase volume, your reset rate, and your average conversion. These are stable, measurable inputs. A firm processing 2,000 challenge purchases per month ($25,000 accounts) at an average fee of €250 (~$270) can reliably project around $540,000 in monthly top-line revenue.
The problem begins at the gross margin line. Everything below revenue depends on what happens once traders get funded – and that’s where most models break down.
Industry data paints a consistent picture of the funnel. According to the publicly available datasets, approximately 14% of traders pass a challenge evaluation and obtain a funded account. Of those who reach funded status, about half ever achieve a payout. Across the full funnel, only around 7% of all challenge purchasers ever receive money back.
But knowing how many traders reach payout doesn’t tell you how much they’ll cost. It’s the second question that determines whether your forecast holds or collapses.
Five Variables That Undermine Forecasting Accuracy
Under the internalization model – where the prop firm absorbs funded-phase risk and pays traders from accumulated challenge revenue – the cost side of the P&L is governed by five variables, none of which are stable enough to forecast with confidence.
1. Payout Ratio
The payout ratio (total payouts divided by total revenue) is the single most important metric in a prop firm’s economics – and the least predictable. FTMO’s filed 2024 accounts reveal that payouts consumed approximately 55% of total revenue – even at the industry’s largest and most established firm. Smaller firms without FTMO’s scale and risk controls typically experience wider swings. In a volatile quarter, the payout ratio can spike to 80%+ of revenue, leaving almost nothing after operating costs. Above 55% is a warning – one volatile month can push payouts past revenue.
2. Cashflow Lag
The average funded trader requests their first payout approximately 2.5 months after purchasing a challenge. This structural delay between revenue recognition and cost realization creates a dangerous illusion: during growth phases, new challenge fees mask old payout obligations. The firm appears more profitable than it actually is. When growth inevitably plateaus, accumulated obligations materialize and margins compress suddenly. Financial models that fail to account for this lag produce projections that diverge from actual performance by one to two quarters.
3. Tail Risk Exposure
Less than 1% of funded traders can generate losses large enough to wipe out months of accumulated profit. Correlated positions across multiple accounts, market exploitation strategies, or simply multiple skilled traders succeeding simultaneously can produce payout spikes that dwarf the fees those accounts generated. With internalization, there is no structural cap on this exposure. The firm absorbs it entirely. On a single $25,000 funded account, a trader generating a 10% return at a 90% profit split costs the firm $2,250 – in a single payout cycle. Multiply that across dozens of accounts in the same month, and a quarter’s margin can evaporate in weeks.
4. Payout Reserve Requirements
Firms internalizing risk must maintain sufficient cash reserves to cover payout obligations that could come due at any time. Every dollar held in reserve is a dollar unavailable for marketing, operations, or growth. As the funded account base expands, reserve requirements grow accordingly – the more funded accounts active simultaneously, the larger the buffer needed to survive a month where a disproportionate number of traders are profitable. This creates a direct trade-off between scale and financial flexibility. Most financial models either ignore this cost entirely or understate it by assuming payout patterns that don’t reflect real-world volatility.
5. Operational Risk Infrastructure
Managing internalized risk requires real-time monitoring, abuse detection, and dedicated personnel. Smaller firms often lack this infrastructure entirely, while mid-sized firms face a growing cost center that rarely surfaces in financial models until costs are already substantial. Risk operations costs of $10,000–$35,000 per month are typical for firms running 200+ funded accounts.
The Forecasting Problem in Numbers
To illustrate the challenge, consider a prop firm processing 2,000 challenge purchases per month at €250 (~$270) each, funding 280 accounts at $25,000 average balance, and generating $540,000 in monthly challenge revenue. Average payout per paying trader is €1,431 (~$1,545), based on FTMO’s published data for $25,000 accounts.
In the internalization model, the cost of a single $25,000 funded account ranges from $0 (trader breaches rules immediately) to over $2,250 (trader generates a 10% return at a 90% profit split) within a single payout cycle. Across 280 accounts, this doesn’t resolve to a cost line – it exists as a probability distribution.
The resulting forecast range:
| P&L Line | Best Case | Average | Worst Case |
| Challenge revenue | $540,000 | $540,000 | $540,000 |
| Payout ratio | 30% | 55% | 80% |
| Payout obligations | $162,000 | $297,000 | $432,000 |
| Capital reserved for payouts | $70,000 | $280,000 | $700,000+ |
| Risk ops overhead | $10,000 | $20,000 | $35,000 |
| Net margin | $368,000 | $223,000 | $73,000 |
| Margin % | 68% | 41% | 14% |
The expected 55% payout ratio is not an estimate – it is the actual ratio from FTMO’s filed 2024 accounts, where payouts of $176.3 million consumed 55% of $322.8 million in global revenue. This is the industry’s most established firm with a decade of operating history and sophisticated risk controls. Smaller firms should expect equal or wider variance.
The spread between best and worst case is approximately $295,000 per month. In the worst case, the firm retains only 14% of revenue – and that’s before any tail risk event. A true tail event in a single month can push the payout ratio past 100%, turning the firm unprofitable.
The Fragility Problem
FTMO’s own financials illustrate how thin the margin of safety is. With a 55% payout ratio and operating expenses of approximately 15% of revenue, FTMO’s breakeven sits at a payout ratio of roughly 85%. That is only 30 percentage points above its current baseline. As TradeInformer noted in its analysis of FTMO’s 2024 accounts: a payout rate increase of approximately 46% – which “could have easily happened over the last few months, given higher levels of market volatility” – would bring FTMO to breakeven. For smaller firms with higher operating costs relative to revenue, the buffer is even thinner.
Risk Transfer: The Fixed-Cost Alternative
Under the full risk transfer model, the funded-phase cost calculation is fundamentally different. Instead of absorbing trader risk with no cost certainty, the prop firm pays a fixed fee – in this case 4.5% of the funded account balance – to a liquidity provider who assumes 100% of the trader’s performance risk.
The mechanics are straightforward: A trader passes your challenge and receives a $25,000 funded account. You pay a fixed fee of $1,125. The provider sets up a hedge account mirroring your challenge conditions. If the trader profits, the provider pays you. If the trader loses, the provider absorbs the loss. Your cost is locked the moment the account goes live.
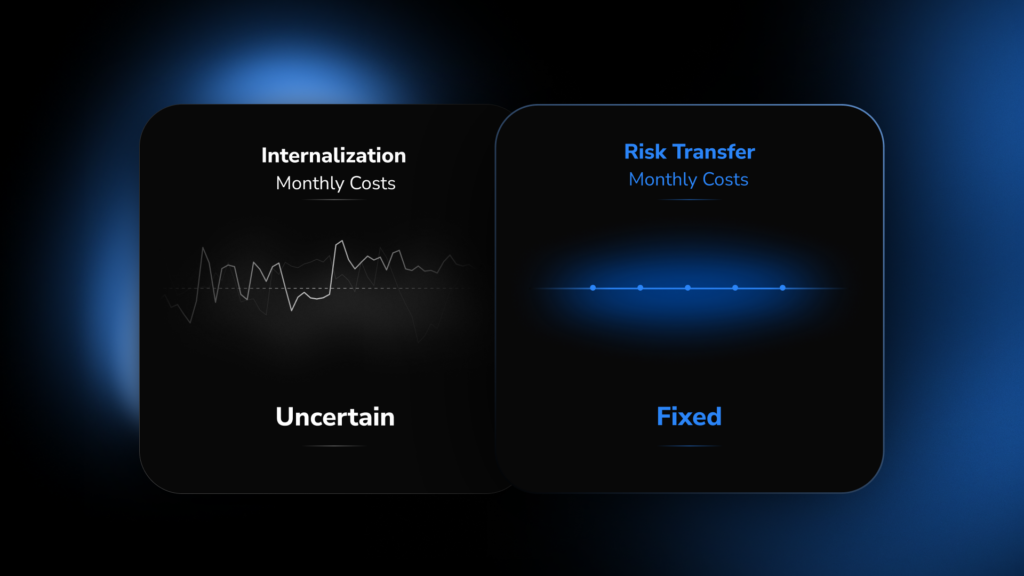
From a forecasting perspective, this transforms the equation. The largest variable in your P&L becomes a fixed line item. The probability distribution collapses into a discrete number.
The same scenario under risk transfer at 4.5%:
| P&L Line | Internalization | Risk Transfer |
| Challenge revenue | $540,000 | $540,000 |
| Funded-phase cost | $162K – $432K | $315,000 |
| Capital reserved for payouts | $70K – $700K+ | $0 |
| Risk ops overhead | $10K – $35K/mo | Minimal |
| Tail risk exposure | Unlimited | Zero |
| Cost per funded account | $0 – $2,250+ | $1,125 (fixed) |
| Total cost (incl. ops) | $172K – $467K | ~$315,000 |
| Net margin | $73K – $368K | ~$225,000/mo |
| Forecast confidence | Low | High |
A critical finding: when you include risk operations overhead, risk transfer at 4.5% costs roughly the same as expected internalization – $315,000 versus $317,000 (payouts plus ops). The premium over payouts alone is just $18,000 per month. For that marginal cost, the firm eliminates all payout variance, all payout reserve requirements, and all tail risk exposure. The cost of certainty is not a premium. It is approximately zero.
How to Build a Reliable P&L
Regardless of the intended use – internal planning, investor analysis, or capital allocation – prop firm P&L models must be structured to reflect operational reality rather than theoretical projections.
Revenue Forecasting (Applies to Both Models)
Project your monthly challenge volume, average fee, and conversion rate. Include reset revenue and any subscription or add-on income. This typically delivers 10–15% accuracy, which provides workable precision for strategic planning.
Cost Analysis – Risk Internalization Model
Track four metrics monthly:
- Payout ratio – total payouts ÷ total revenue. FTMO’s actual 2024 ratio was 55%. Above that is a warning – one volatile month can push payouts past revenue.
- Average cost per funded account – total payouts ÷ number of funded accounts active in the period.
- Maximum single-account exposure – largest single payout (your tail risk indicator).
- Payout reserves – total cash held to cover potential trader payouts, unavailable for operations.
Most founders conducting this analysis for the first time discover their actual cost per funded account exceeds initial assumptions by 2–5×. Model construction should incorporate three scenarios (optimistic, average, pessimistic) with stress testing against the worst historical month rather than average results.
Cost Analysis – Risk Transfer Model
Funded-phase cost equals the transfer fee percentage multiplied by account balance, multiplied by the number of funded accounts. For 280 accounts at $25,000 and 4.5%, that’s $315,000 per month. This constitutes the complete calculation. Scenario planning, variance modeling, and stress testing become unnecessary for this line item. Monitoring, hedging, payout reserve management, and tail risk transfer entirely to the provider.
The Scaling Multiplier
The two approaches diverge most dramatically in a financial model.
With internalization, expanding from 280 to 2,800 funded accounts multiplies variance, payout reserve requirements, and tail loss exposure along with revenue. Forecast error increases non-linearly with volume growth, risk compounds systematically, and growth becomes self-limiting.
With risk transfer, scaling from 280 to 2,800 funded accounts multiplies both revenue and cost by the same factor. Both margins and forecast accuracy remain constant. Growth doesn’t introduce new risk categories, instead replicating the same predictable line item.
For prop firm founders modeling a 12–24-month growth trajectory, this difference separates a financial plan that holds up under scrutiny from one that requires a disclaimer on every page.
Making the Strategic Choice
Profitability forecasting is only as reliable as the inputs it’s built on. A prop firm P&L with variable, unpredictable funded-phase costs can’t support strategic decision-making – not for founders, not for investors, and not for operational teams.
The choice between models comes down to whether the largest cost in your P&L should remain a probability distribution or become a fixed number. For firms prioritizing forecast accuracy, capital efficiency, and scalable growth, that choice is clear.